



A favourite reversed, most compared Back prices matched, and a higher headline price had only £9 available. Our screen-recording study shows why time, market type and available amount belong in the same comparison.
By BrokerStorm Research · Prepared 4 November 2026 · Capture dates: 30-31 October 2026
Method | Favourite reversal | The £9 example | Conclusion | Complete tables | Sources
Hull was the shorter-priced team on Friday. Ipswich was the shorter-priced team on Saturday. In a different fixture, Nottingham Forest had a higher Back price on Matchbook than on Betfair, but just £9 was displayed at that higher level. Both observations are easy to turn into a headline. Understanding what they mean takes a closer look at the screens. [1][2]
BrokerStorm reviewed supplied recordings and screenshots dated 30-31 October 2026 to examine two questions: how prices changed between days on the same platform, and how displayed quotes differed between platforms in the Saturday recordings. The result is a practical case study in reading exchange prices, with the source frames and calculations available for inspection.
The main findings. Hull’s Matchbook Back price rose from 2.72 to 3.15, while Ipswich shortened from 2.86 to 2.44. Across the Saturday Betfair-Matchbook sample, 15 of 22 selections had identical Back prices and seven differed. The higher price depended on the selection, and its practical significance depended on the amount shown at that level. [1][2]
What we compared – and what the recordings can establish
A time comparison and a platform comparison answer different questions. We keep them separate. The day-to-day decimal analysis uses Matchbook on both days, matching the fixture, selection, market line and Back side. The Saturday analysis compares Betfair and Matchbook frames captured sequentially within each recording. Smarkets contributes a separate view using its displayed BUY percentages. [1][2]
Study coverage
| Comparison | Coverage | Measure |
|---|---|---|
| Friday vs Saturday: Matchbook | 5 markets / 13 selections | Decimal Back prices; Lay and amounts retained |
| Friday vs Saturday: Smarkets | 8 markets / 20 selections | Displayed BUY percentages |
| Saturday: Betfair vs Matchbook | 5 fixtures / 9 markets / 22 selections | Back and Lay quotes, with GBP amounts |
The observations are pre-match snapshots, not verified closing prices. Different platforms were not recorded simultaneously. In the Bournemouth match-result comparison the selected frames are 18 seconds apart; in Brentford-Forest they are 15 seconds apart. Those gaps are small, but they prevent us from describing the quotes as simultaneous executable offers.
The Friday filename, phone display and video-container timestamp do not provide one consistent time-zone-normalised clock; Saturday fixture times also differ across interfaces. We therefore use the supplied calendar-day grouping and source-video offsets, without claiming an exact elapsed number of hours. Fixture names and dates describe the supplied records; this study does not independently verify the competition schedule or the cause of a price change.
Hull-Ipswich: the favourite changed on the same platform
On Friday, Matchbook displayed Hull at 2.72 and Ipswich at 2.86. By the Saturday observation, Hull was 3.15 and Ipswich 2.44. Because the lower decimal price identifies the shorter-priced selection, the order of the two teams had reversed. The draw moved from 3.50 to 3.60. [1][2]
Matchbook match-result Back prices
| Selection | Friday | Saturday | Price change |
|---|---|---|---|
| Hull | 2.72 | 3.15 | +15.8% |
| Draw | 3.50 | 3.60 | +2.9% |
| Ipswich | 2.86 | 2.44 | -14.7% |
Figure 1. Hull-Ipswich: the two Matchbook observations
Friday 30 October | Matchbook | source video 00:35.5
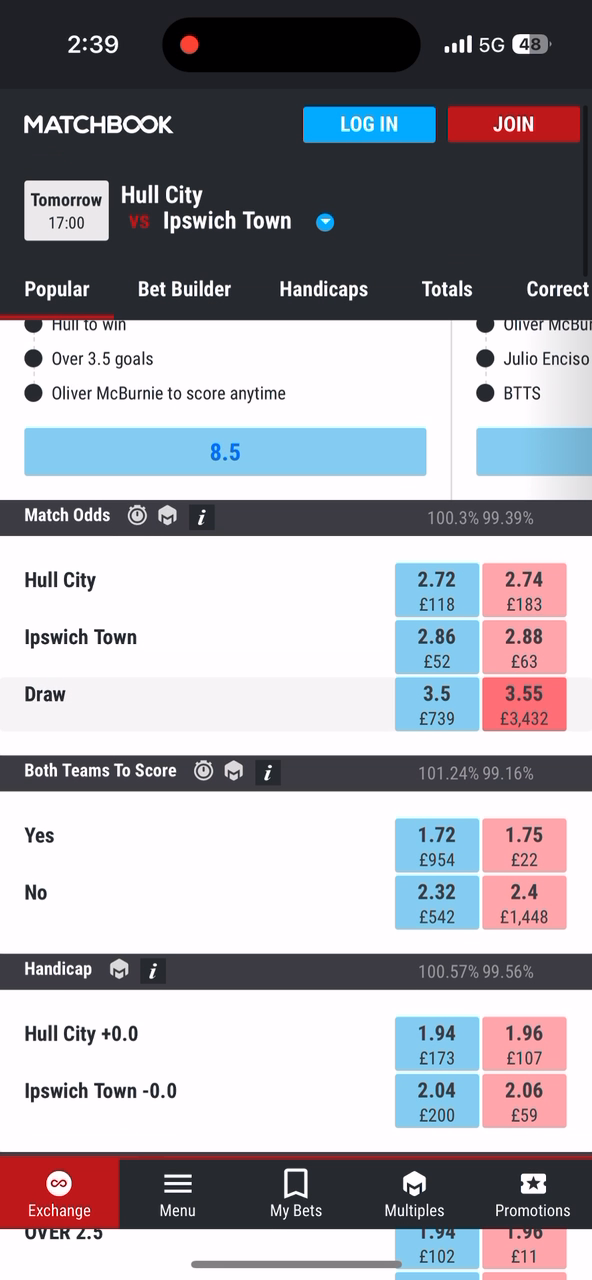
Click the image to inspect the full original frame: FR-MB-Hull-1X2
Saturday 31 October | Matchbook | V02 at 00:13
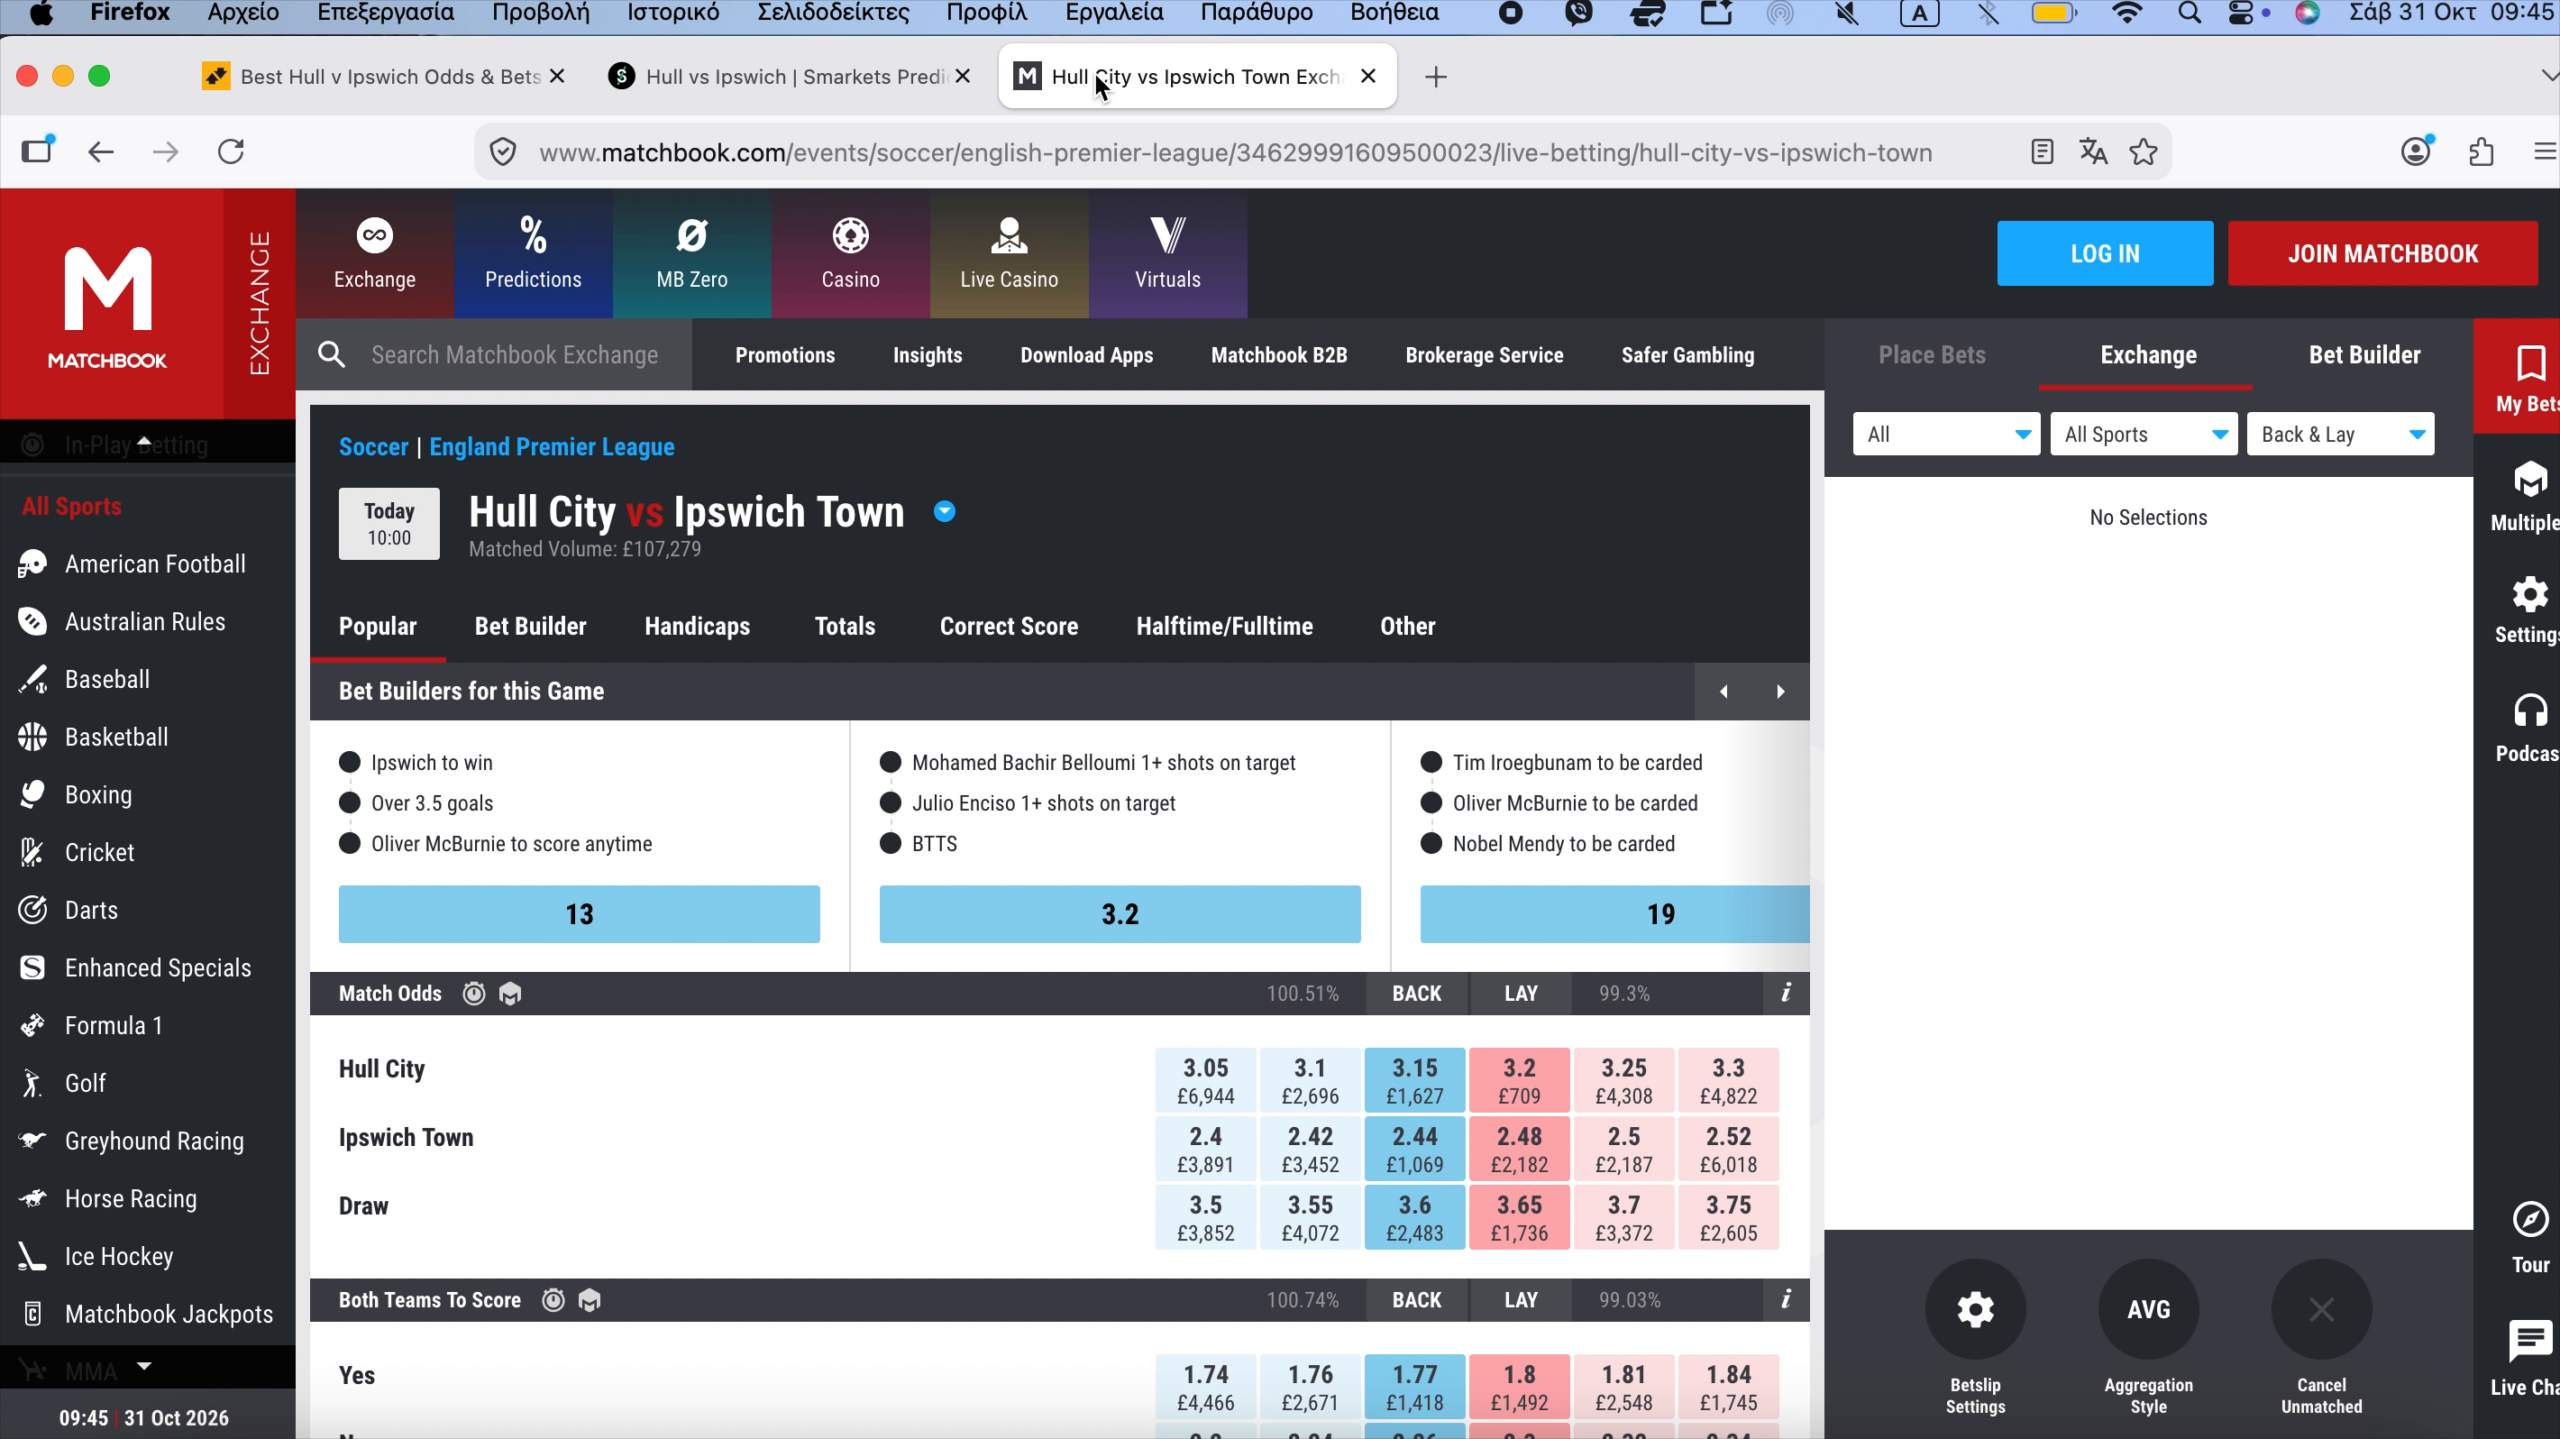
Click the image to inspect the full original frame: V02-MB
The same three match-result selections, captured on the same platform on different days. The crops preserve the original prices and amounts. Editorial labels sit outside the source images. [1][2]
The percentage calculation is deliberately simple:
Decimal price change (%) = (Saturday price / Friday price – 1) × 100
Hull: (3.15 / 2.72 – 1) × 100 = +15.8%.
Ipswich: (2.44 / 2.86 – 1) × 100 = -14.7%.
These are changes in decimal price, not investment returns and not percentage-point changes in a team’s probability. Using the standard reciprocal conversion, Hull’s raw implied probability changes from approximately 36.76% to 31.75%: a decline of about 5.02 percentage points, calculated before rounding. That conversion is not an independently estimated “true chance”; it does not adjust the complete market for its pricing structure or commission. [5]
The reversal is observable. Its cause is not. The material does not establish whether team news, participant activity, a thin quote, or another factor drove it. Nor do two endpoints show the route the price took between them.
A match-result move does not describe every market
The Hull totals market changed much less in relative decimal-price terms. On Matchbook, Over 2.5 moved from 1.94 to 2.00, or +3.1%; Under 2.5 moved from 2.04 to 1.98, or -2.9%. The pricing shifted towards Under at these endpoints while the match-result market shifted towards Ipswich. [1][2]
Those observations are compatible: which team wins and how many goals the match contains are different questions. The markets are related, but one selection’s movement is not a substitute for inspecting another market. The comparison also does not imply that percentage price changes in different selections are additive or equally significant in probability terms.
Figure 2. Hull-Ipswich: total match goals, line 2.5
Friday | Matchbook total match goals | 00:36.5
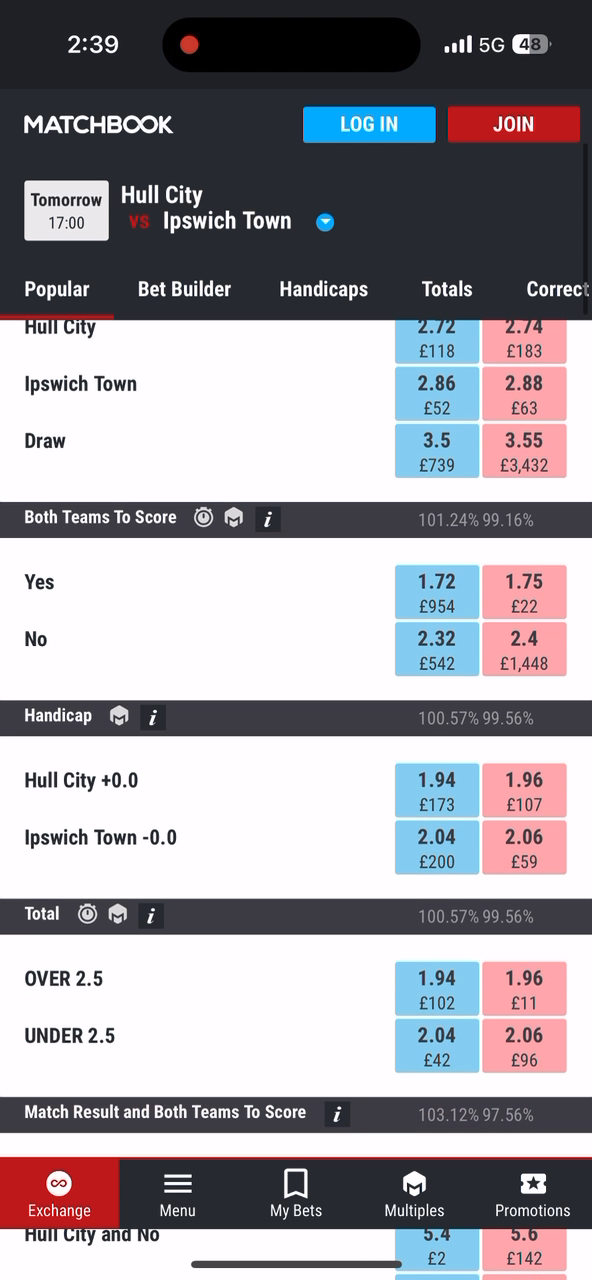
Click the image to inspect the full original frame: FR-MB-Hull-AH0-OU25
Saturday | Matchbook total match goals | V08 at 00:13
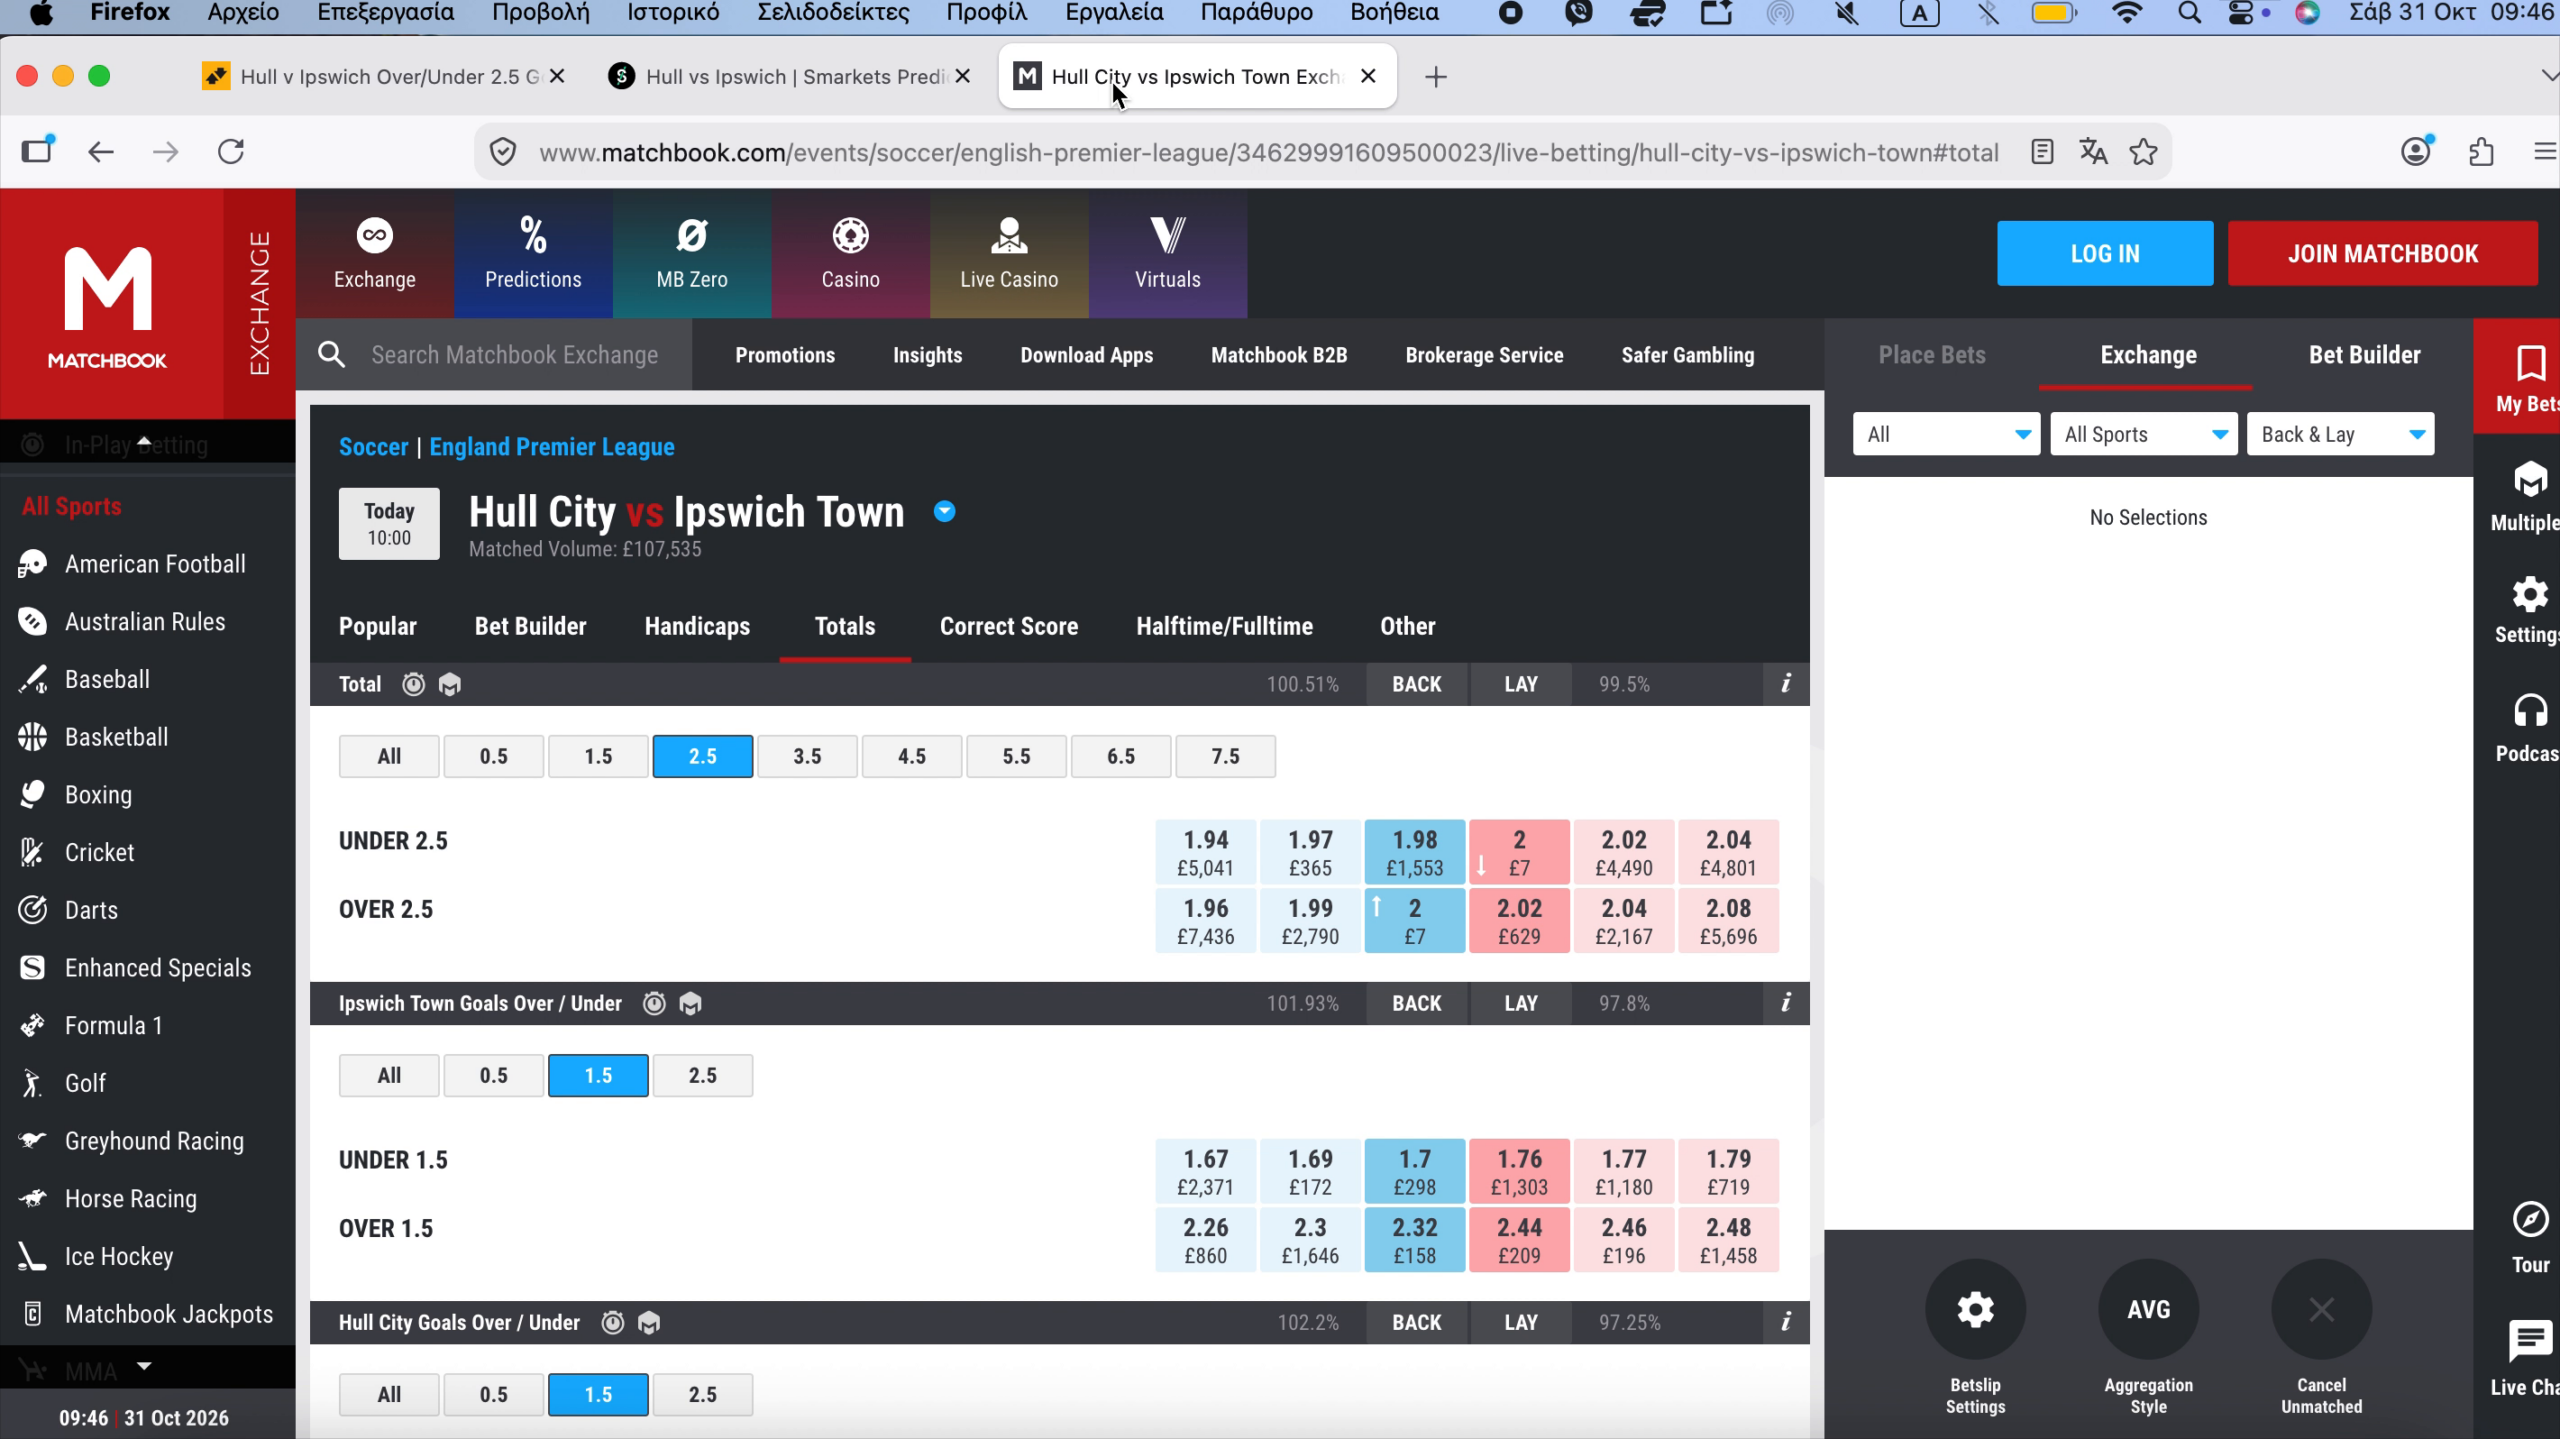
Click the image to inspect the full original frame: V08-MB
The comparison uses total match goals on both days. The team-goals markets visible elsewhere in the full Saturday frame are different contracts and are excluded. [1][2]
Coventry-Sunderland provides a second pattern. Coventry’s Matchbook win price stayed at 3.30, while Under 2.5 rose from 1.91 to 2.00 (+4.7%) and Over 2.5 shortened from 2.06 to 1.98 (-3.9%). A stable home-win quote therefore did not mean unchanged pricing across the match. [1][2]
There is an important scale detail: the Friday Coventry Under quote of 1.91 showed only £3 at that level. Saturday’s Hull Over quote of 2.00 showed only £7. Both prices belong in the record, but neither should be presented without its displayed amount when discussing practical availability.
Which exchange displayed the higher price? It depended on the selection
In the Saturday Bournemouth-Leeds match-result recording, Betfair displayed Leeds at 4.10 while Matchbook showed 4.00. For Bournemouth, Matchbook displayed 2.10 against Betfair’s 2.08. Even within one fixture, the higher Back price changed platform. [2]
The amounts were different too: Bournemouth’s 2.10 on Matchbook showed £32, compared with £2,397 at Betfair’s 2.08. These are amounts at the quoted level, not the total money in the market. A higher displayed Back price describes one dimension of the quote; it does not establish which venue could fill a particular order at the best average price.
The complete Saturday table below includes every selection in the defined nine-market sample. Fifteen Back prices matched; seven differed. Among those seven, Matchbook displayed the higher price in four and Betfair in three. These are sample counts from sequential screenshots, not a platform ranking. Equal headline prices can still have different amounts available. [2]
The £9 price: a worked example of available depth
Nottingham Forest to win: Saturday captures
| Platform | Best visible Back | Amount at that price |
|---|---|---|
| Matchbook | 3.55 | £9 |
| Betfair | 3.50 | £3,308 |
Figure 3. Nottingham Forest: headline price and available amount
Matchbook | V03 at 00:16 | Forest 3.55 / £9
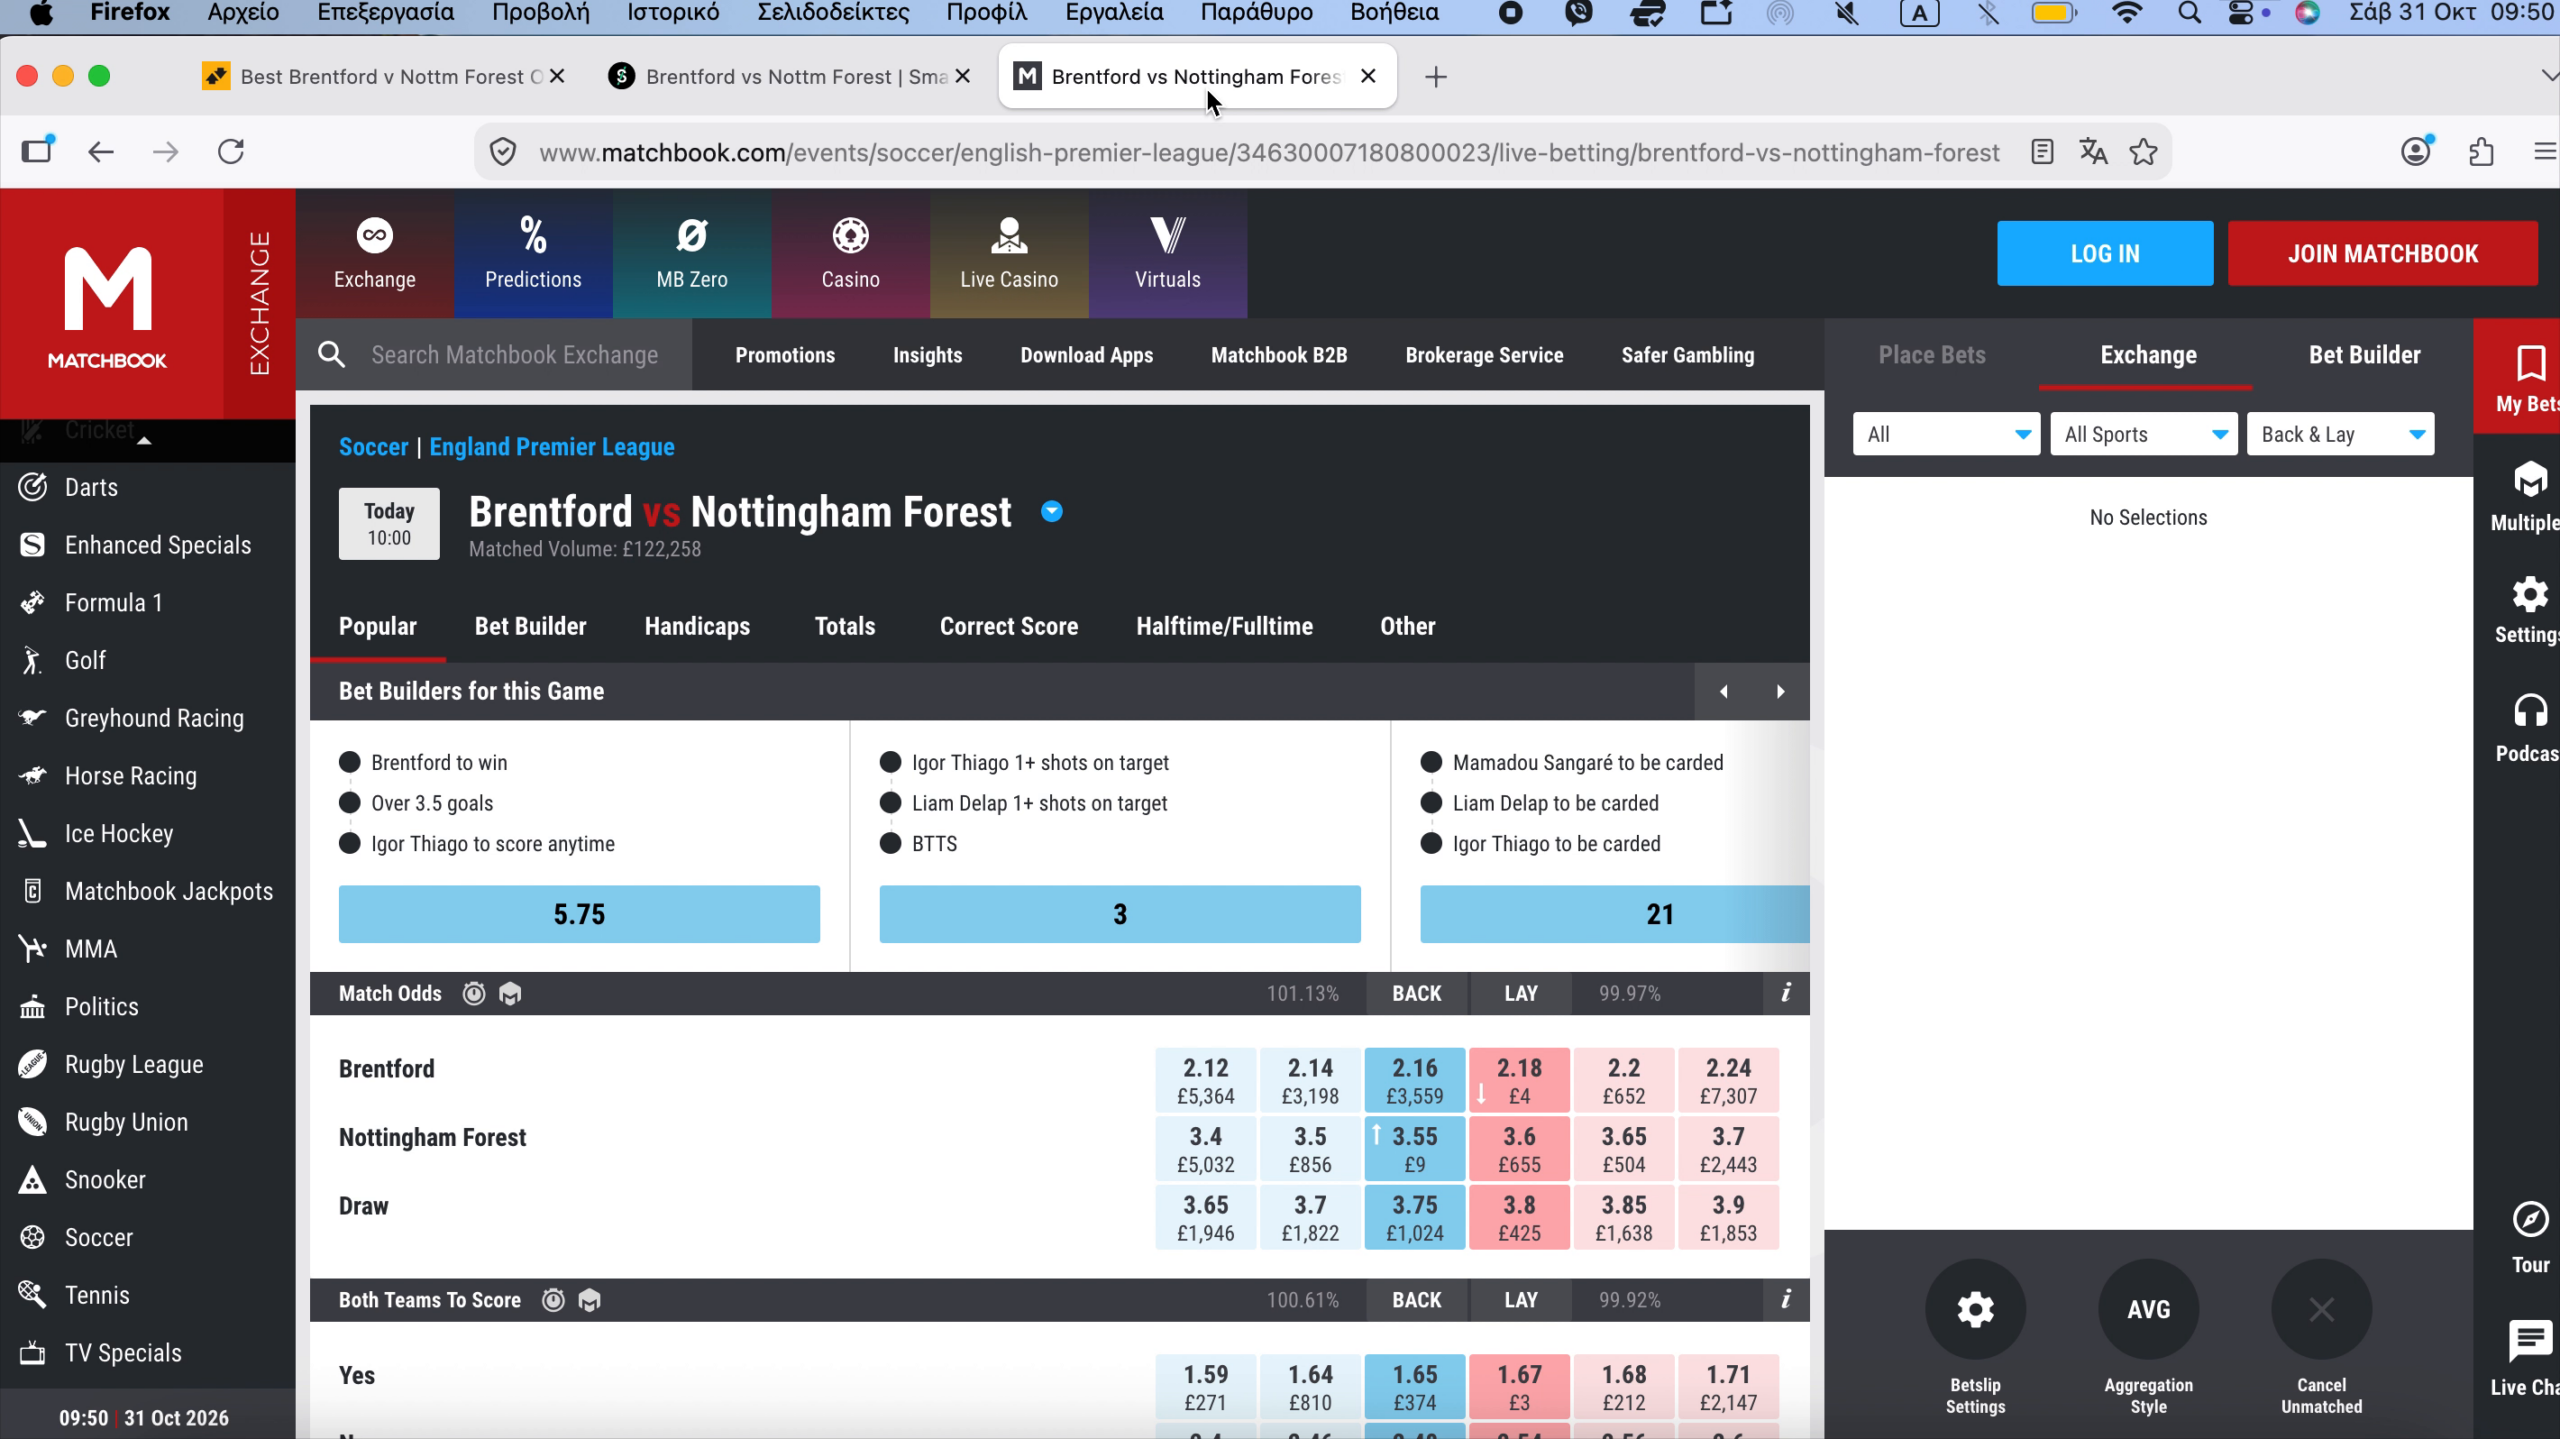
Click the image to inspect the full original frame: V03-MB
Betfair | V03 at 00:01 | Forest 3.50 / £3,308
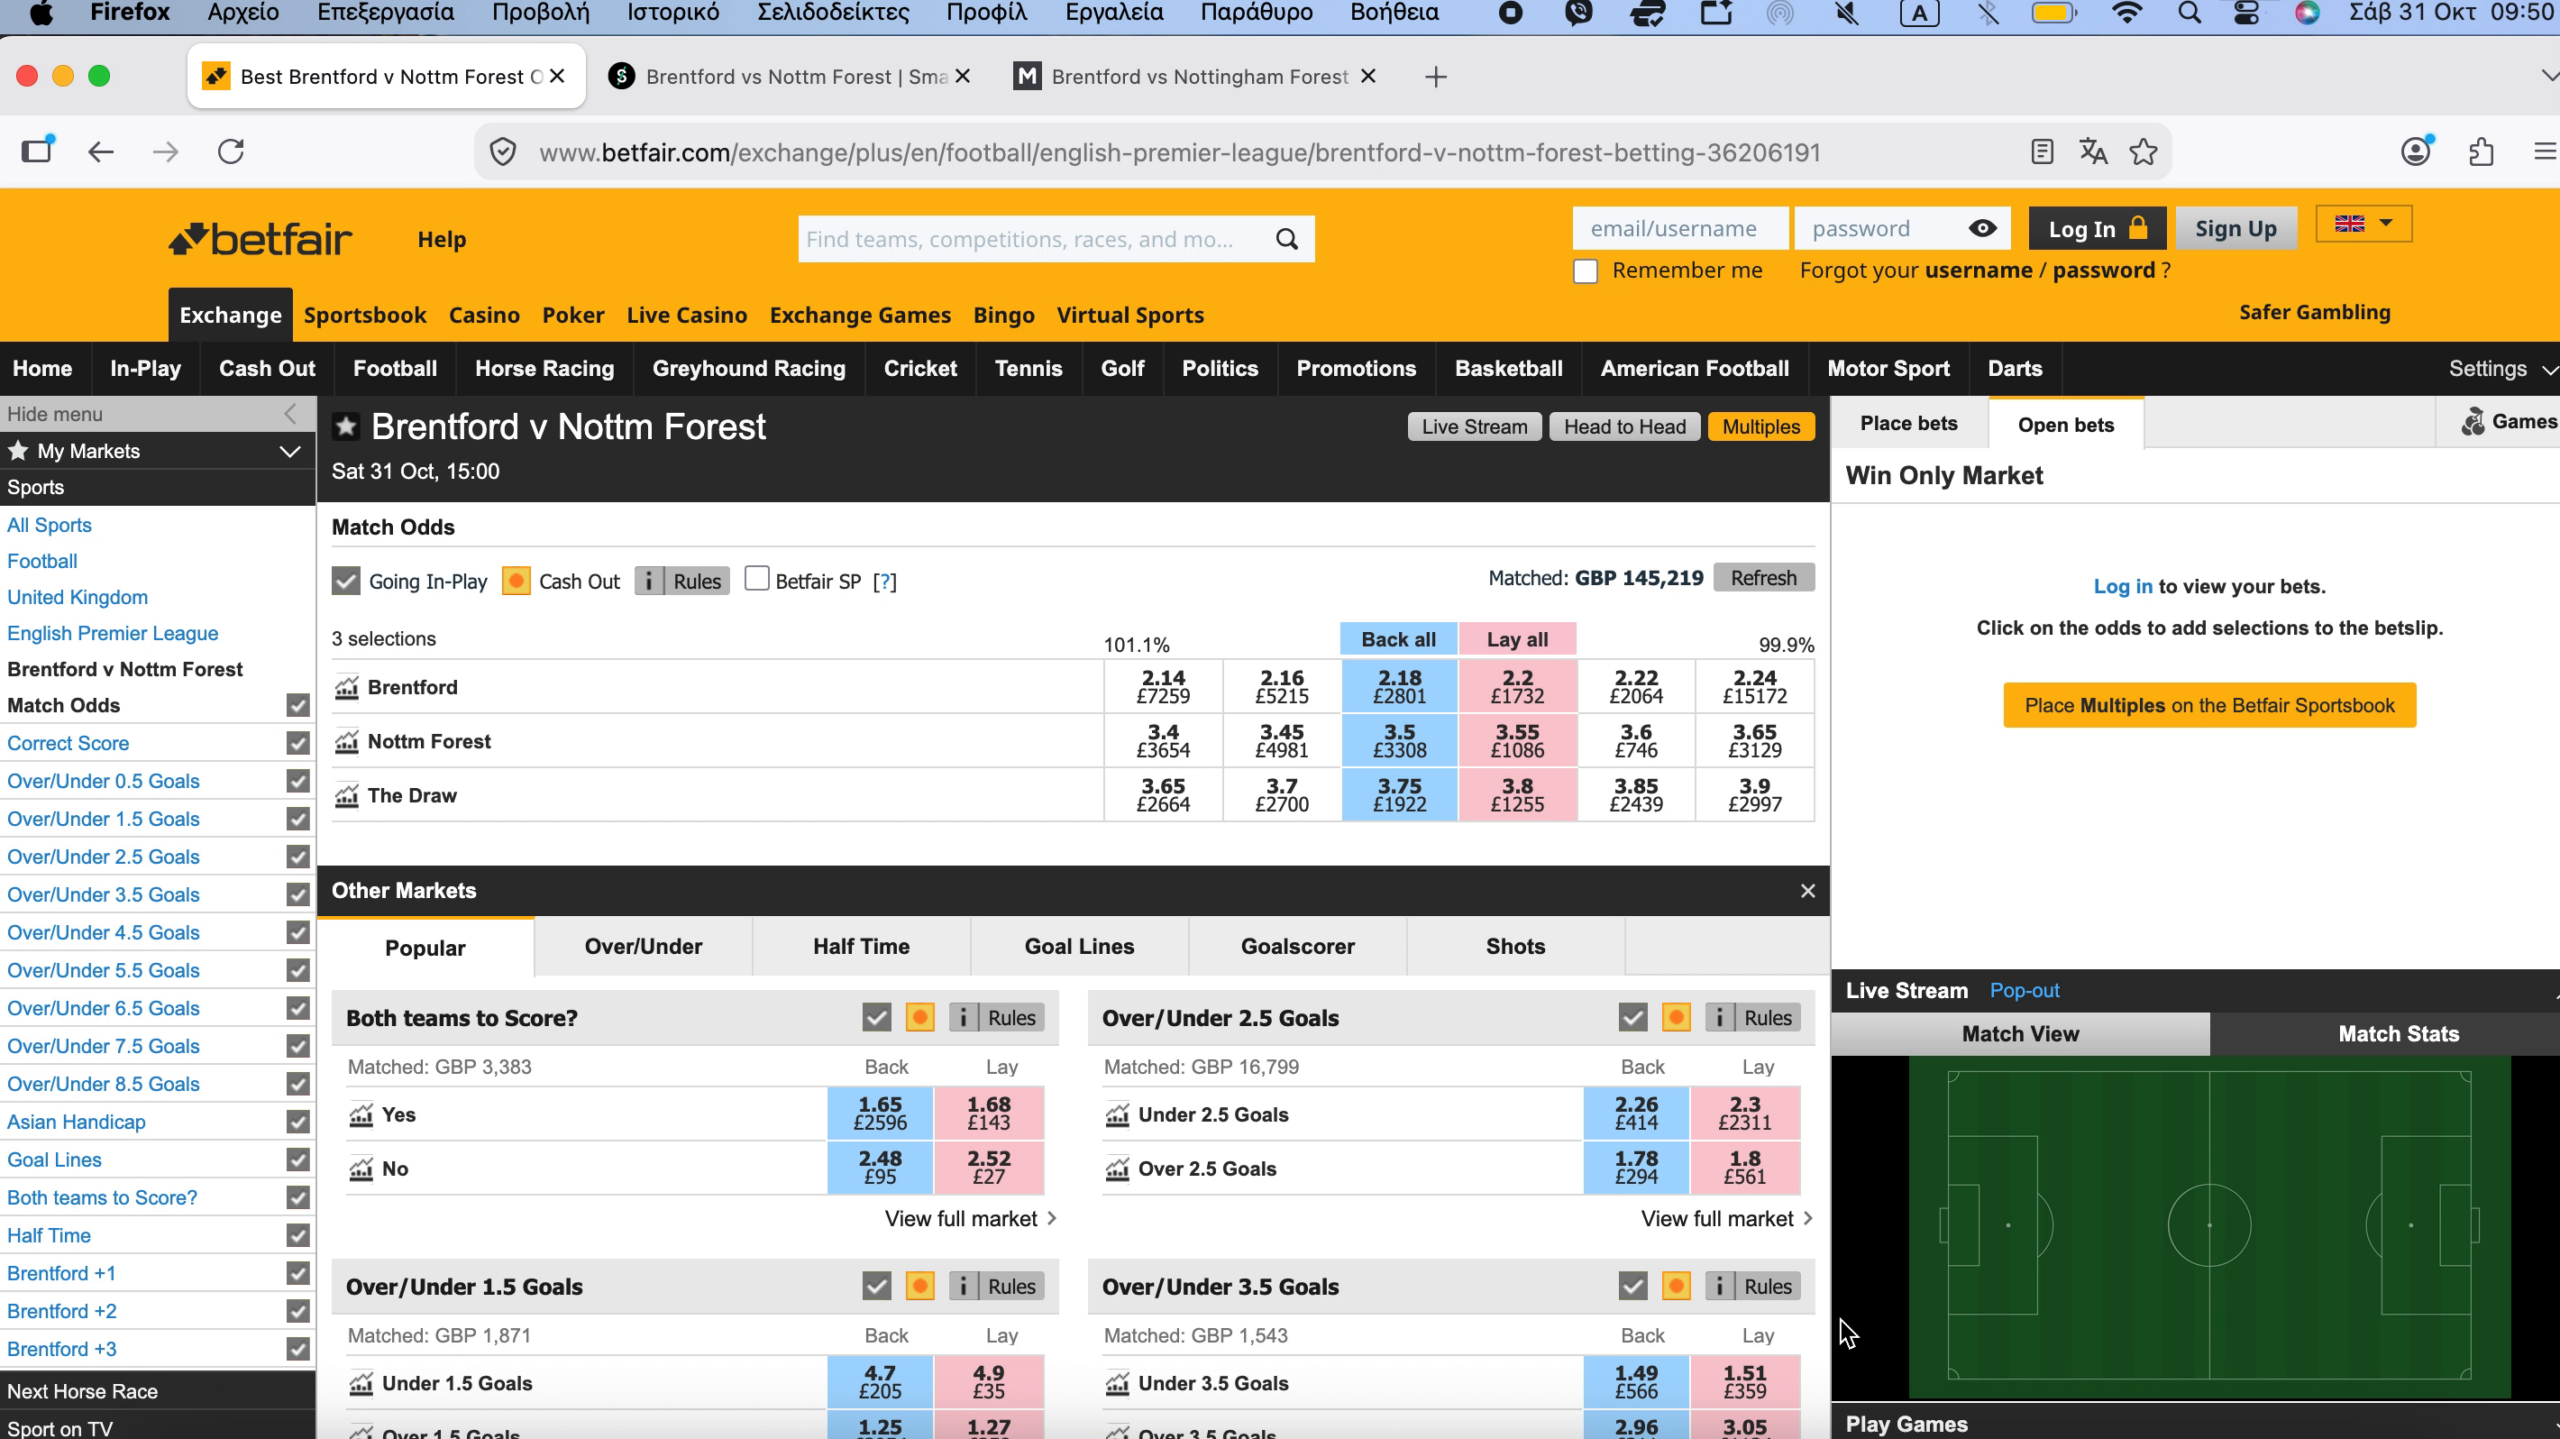
Click the image to inspect the full original frame: V03-BF
The captures are 15 seconds apart. Matchbook’s adjacent Back level also shows 3.50 with £856. That visible second level supports the hypothetical calculation below; it is not an executed transaction. [2]
At first glance, 3.55 is plainly higher than 3.50. But the Matchbook frame also shows the next Back level: 3.50 with £856. This lets us illustrate how a larger order changes the comparison without inventing unseen prices.
Hypothetical static-book example: suppose £100 could be matched against exactly the displayed levels, with no quotes changing during execution and no other constraints. The first £9 would fill at 3.55 and the remaining £91 at 3.50. The stake-weighted average decimal price would be:
(£9 × 3.55 + £91 × 3.50) / £100 = 3.5045
If the selection won, gross profit would be £250.45, versus £250.00 for £100 at 3.50.
The difference is £0.45 before commission, not £5.
The calculation uses visible depth, but it remains an illustration: no £100 execution was tested, the two platforms were captured at different moments, and prices or amounts could have changed before an order arrived. Betfair’s own guide explains both what the amounts below the odds represent and why a displayed amount is not a guarantee of matching. [3]
Nor does the £9 figure mean the entire Matchbook market contained £9. It refers to one displayed price level. Market-wide matched volume, available depth across several levels and the amount at the best visible price are three different quantities.
Back and Lay: matching one side is not matching the whole quote
Back supports an outcome; Lay takes the other side of that outcome. At a fixed backer’s stake, a higher Back price increases potential profit, while a lower Lay price reduces liability. These comparisons still require the same selection, terms and available amount. [3]
For Brentford-Forest Over 2.5 on Saturday, both platforms displayed Back 1.78. Betfair’s Lay was 1.80, with £497 displayed; Matchbook’s was 1.79, with £60. Their Back amounts also differed: £526 on Betfair and £3 on Matchbook. An identical Back number did not mean an identical two-sided market. [2]
The full Lay comparison is included alongside the Back table in the supporting data. We do not label a spread difference as an arbitrage opportunity: that would require a complete executable strategy, simultaneous prices, sufficient amounts, settlement compatibility and costs.
Smarkets: a useful additional view, at the precision shown
The Friday and Saturday Smarkets screens show Hull’s BUY figure changing from 37% to 32%, while Ipswich changes from 35% to 41%. The direction agrees with the Matchbook observations: Hull becomes longer-priced, Ipswich shorter-priced. Tottenham-Crystal Palace Over 2.5 changes from 60% to 58%, and Coventry-Sunderland Over 2.5 from 50% to 52%. [1][2]
We preserve these values as displayed. The Hull change is -5 percentage points; the Ipswich change is +6 percentage points. They are not the same metric as the earlier +15.8% and -14.7% changes in decimal odds. Smarkets explains that its matching system uses percentage prices and that displayed odds formats involve rounding. [6]
The whole-number BUY values in these captures cannot recover an exact historical order-book price. We therefore do not invert 37% into a supposedly precise executable decimal quote. The rounded displays are an additional observation, not a prediction model or proof of statistically independent confirmation.
Commission belongs in the comparison
All recorded decimal prices in this study are before commission. A gross-price advantage is not necessarily a net-profit advantage. Betfair states that its exchange commission is charged on net winnings in a market, with the applicable rate depending on account arrangements. This is why a single universal rate should not be silently applied to every platform or account. [4]
For a simplified single winning Back position, with commission rate c applied to its profit and no other positions offsetting that profit, the effective decimal return is 1 + (odds – 1) × (1 – c). Actual market-level charges must be calculated under the account’s rules. We have no verified account-specific rates for these recordings, so the tables do not claim a net-of-commission winner.
Why some supplied screenshots do not become day-to-day claims
The wider material includes Blackfair screenshots, alternative goal and handicap lines, and La Liga fixtures. Those records are retained as context, but they cannot fill every gap in the paired study. No Friday Betfair-branded recording was supplied, and no Saturday La Liga capture was available.
Blackfair and Betfair remain separately labelled sources. Similar layouts or matching prices do not, on their own, establish a shared operator or identical order book. Comparing a Friday Blackfair quote with a Saturday Betfair quote changes both day and source; the difference cannot be attributed solely to time. The supplementary dataset labels those comparisons accordingly.
Likewise, Under 2.5, Under 3.5 and a split 3.0/3.5 line are different contracts. Browsing between them does not create a time series of the same price. Only matching selections and lines enter the paired tables. Blackfair USD amounts, Smarkets Friday NOK amounts and the GBP amounts used here are not directly compared.
What the evidence supports – and what remains open
This is a small, selected observational sample, not a random or representative survey of exchanges. Selections within the same market are related; the 22 rows are not 22 independent experiments. We have no continuous price history, synchronised feed, verified closing-price benchmark, order-execution logs, account-specific commission schedule or controlled model forecast for these comparisons.
Screenshots establish what was displayed in selected frames. They do not establish a guaranteed fill, a profitable strategy, the reason a price moved, or predictive success. A later match result would not by itself validate the quality of the price available beforehand. Current help-centre pages are cited for terminology and calculation methods, not as evidence of historical quotes or historical account terms.
The source index records video offsets and image identifiers. Full source frames and the original transcription are preserved in the publication package, with SHA-256 checksums for verification. Display crops are labelled and never redraw prices. The personal account transaction screenshot is excluded.
A five-part check before comparing any two prices
The practical comparison checklist
| Check | Question to ask |
|---|---|
| Selection and line | Is this the same outcome and contract, including total match goals versus team goals? |
| Side | Am I comparing Back with Back, or Lay with Lay? |
| Time | Were the quotes simultaneous, or merely captured close together? |
| Amount and depth | How much was displayed at this price, and which other levels are visible? |
| Costs and execution | What commission and matching constraints apply to the actual account? |
Conclusion
We conducted this research to understand how much an exchange price comparison can tell us when we examine the evidence behind the numbers. By following the same markets across two days and comparing different platforms, we wanted to connect displayed odds with the conditions that determine their practical usefulness: timing, available amounts, market depth and costs.
The recordings revealed three distinct patterns. Prices could change substantially between observations: on Matchbook, Hull moved from 2.72 to 3.15 while Ipswich shortened from 2.86 to 2.44, reversing which team was the shorter-priced selection. Different markets within the same fixture could also behave differently: Coventry’s win price remained at 3.30 while its match-goals prices changed. Across platforms, most headline prices in our Saturday sample matched (15 of 22 Back selections), but the higher quote among the remaining seven varied by selection. [1][2]
Together, these findings show why a useful comparison must be specific. A platform, fixture or day cannot be described adequately by one attractive number. The relevant unit of comparison is the same selection, in the same market, on the same side, observed at a clearly identified time.
The Nottingham Forest example makes the practical implications particularly clear. Matchbook displayed 3.55 with £9 available, while Betfair displayed 3.50 with £3,308. Using Matchbook’s visible second price level, our hypothetical £100 order produced an average price of 3.5045. If the selection won, that would mean just £0.45 more gross profit than £100 at 3.50, before commission. This calculation assumes unchanged quotes and complete matching; it illustrates the effect of available depth without claiming an execution actually occurred. [2]
For readers, the lesson translates into a more complete question: what average price could be obtained for the intended amount, under the applicable costs and matching conditions? The highest displayed Back price is one input. The amount available, adjacent price levels, commission and the possibility of quotes changing determine how much of that apparent advantage might survive in practice. [3][4]
The study also sets boundaries around its conclusions. Selected screenshots cannot establish why a market moved, whether an order would have filled, or whether a strategy would be profitable. Our sequential captures and limited sample do not support a universal ranking of exchanges. Establishing persistent advantages would require a larger sample, synchronised observations, verified costs and execution records.
BrokerStorm’s contribution here is a comparison readers can inspect: original frames, explicit calculations and clearly stated limitations. The research gives those screenshots analytical value by connecting each observation to a practical consequence. It provides a repeatable standard for future comparisons, one that evaluates the price together with the conditions under which it could actually be used.
Publisher’s note. This research is published by BrokerStorm, a business active in exchange-related services. It is a publisher-produced historical case study, not an independent industry-wide audit. The observations do not establish a universal best platform.
Supporting data: the complete comparisons
The tables retain unchanged observations. Monetary amounts are GBP at the selected displayed level; they are not full market depth. Percentages in the Matchbook table are rounded to one decimal place after calculation. Rows are linked to the source index by recording ID. [1][2]
A. Matchbook: all 13 same-platform Back comparisons
| Fixture / selection | Friday Back (amount) | Saturday Back (amount) | Change | Frame IDs |
|---|---|---|---|---|
| Hull – Ipswich / Hull | 2.72 (£118) | 3.15 (£1,627) | +15.8% | FR-MB-Hull-1X2 / V02-MB |
| Hull – Ipswich / Draw | 3.50 (£739) | 3.60 (£2,483) | +2.9% | FR-MB-Hull-1X2 / V02-MB |
| Hull – Ipswich / Ipswich | 2.86 (£52) | 2.44 (£1,069) | -14.7% | FR-MB-Hull-1X2 / V02-MB |
| Brentford – Nottingham Forest / Brentford | 2.16 (£228) | 2.16 (£3,559) | +0.0% | FR-MB-Brentford-1X2 / V03-MB |
| Brentford – Nottingham Forest / Draw | 3.80 (£296) | 3.75 (£1,024) | -1.3% | FR-MB-Brentford-1X2 / V03-MB |
| Brentford – Nottingham Forest / Nottingham Forest | 3.60 (£34) | 3.55 (£9) | -1.4% | FR-MB-Brentford-1X2 / V03-MB |
| Coventry – Sunderland / Coventry | 3.30 (£218) | 3.30 (£189) | +0.0% | FR-MB-Coventry-1X2 / V04-MB |
| Coventry – Sunderland / Draw | 3.45 (£1,190) | 3.50 (£48) | +1.4% | FR-MB-Coventry-1X2 / V04-MB |
| Coventry – Sunderland / Sunderland | 2.40 (£509) | 2.42 (£214) | +0.8% | FR-MB-Coventry-1X2 / V04-MB |
| Coventry – Sunderland / Under 2.5 | 1.91 (£3) | 2.00 (£295) | +4.7% | FR-MB-Coventry-OU25 / V07-MB |
| Coventry – Sunderland / Over 2.5 | 2.06 (£178) | 1.98 (£7) | -3.9% | FR-MB-Coventry-OU25 / V07-MB |
| Hull – Ipswich / Under 2.5 | 2.04 (£42) | 1.98 (£1,553) | -2.9% | FR-MB-Hull-AH0-OU25 / V08-MB |
| Hull – Ipswich / Over 2.5 | 1.94 (£102) | 2.00 (£7) | +3.1% | FR-MB-Hull-AH0-OU25 / V08-MB |
B. Saturday: all 22 Back comparisons
| Fixture / selection | Betfair Back (amount) | Matchbook Back (amount) | Higher quote | Video |
|---|---|---|---|---|
| Bournemouth – Leeds / Bournemouth | 2.08 (£2,397) | 2.10 (£32) | Matchbook | V01 |
| Bournemouth – Leeds / Draw | 3.55 (£2,729) | 3.50 (£2,814) | Betfair | V01 |
| Bournemouth – Leeds / Leeds | 4.10 (£2,167) | 4.00 (£1,455) | Betfair | V01 |
| Hull – Ipswich / Hull | 3.15 (£1,901) | 3.15 (£1,627) | Same | V02 |
| Hull – Ipswich / Draw | 3.60 (£4,066) | 3.60 (£2,483) | Same | V02 |
| Hull – Ipswich / Ipswich | 2.44 (£1,198) | 2.44 (£1,069) | Same | V02 |
| Brentford – Nottingham Forest / Brentford | 2.18 (£2,801) | 2.16 (£3,559) | Betfair | V03 |
| Brentford – Nottingham Forest / Draw | 3.75 (£1,922) | 3.75 (£1,024) | Same | V03 |
| Brentford – Nottingham Forest / Nottingham Forest | 3.50 (£3,308) | 3.55 (£9) | Matchbook | V03 |
| Coventry – Sunderland / Coventry | 3.30 (£1,336) | 3.30 (£189) | Same | V04 |
| Coventry – Sunderland / Draw | 3.50 (£86) | 3.50 (£48) | Same | V04 |
| Coventry – Sunderland / Sunderland | 2.42 (£207) | 2.42 (£214) | Same | V04 |
| Bournemouth – Leeds / Under 2.5 | 2.02 (£687) | 2.02 (£164) | Same | V05 |
| Bournemouth – Leeds / Over 2.5 | 1.95 (£200) | 1.96 (£19) | Matchbook | V05 |
| Tottenham – Crystal Palace / Under 2.5 | 2.28 (£1,082) | 2.28 (£1,313) | Same | V06 |
| Tottenham – Crystal Palace / Over 2.5 | 1.76 (£140) | 1.76 (£195) | Same | V06 |
| Coventry – Sunderland / Under 2.5 | 2.00 (£466) | 2.00 (£295) | Same | V07 |
| Coventry – Sunderland / Over 2.5 | 1.98 (£205) | 1.98 (£7) | Same | V07 |
| Hull – Ipswich / Under 2.5 | 1.98 (£1,522) | 1.98 (£1,553) | Same | V08 |
| Hull – Ipswich / Over 2.5 | 1.99 (£2,006) | 2.00 (£7) | Matchbook | V08 |
| Brentford – Nottingham Forest / Under 2.5 | 2.26 (£258) | 2.26 (£318) | Same | V09 |
| Brentford – Nottingham Forest / Over 2.5 | 1.78 (£526) | 1.78 (£3) | Same | V09 |
C. Saturday: all 22 Lay comparisons
| Fixture / selection | Betfair Lay (amount) | Matchbook Lay (amount) | Lower quote | Video |
|---|---|---|---|---|
| Bournemouth – Leeds / Bournemouth | 2.10 (£25) | 2.12 (£1,038) | Betfair | V01 |
| Bournemouth – Leeds / Draw | 3.60 (£872) | 3.60 (£283) | Same | V01 |
| Bournemouth – Leeds / Leeds | 4.20 (£3,080) | 4.10 (£22) | Matchbook | V01 |
| Hull – Ipswich / Hull | 3.20 (£1,055) | 3.20 (£709) | Same | V02 |
| Hull – Ipswich / Draw | 3.65 (£1,701) | 3.65 (£1,736) | Same | V02 |
| Hull – Ipswich / Ipswich | 2.46 (£654) | 2.48 (£2,182) | Betfair | V02 |
| Brentford – Nottingham Forest / Brentford | 2.20 (£1,732) | 2.18 (£4) | Matchbook | V03 |
| Brentford – Nottingham Forest / Draw | 3.80 (£1,255) | 3.80 (£425) | Same | V03 |
| Brentford – Nottingham Forest / Nottingham Forest | 3.55 (£1,086) | 3.60 (£655) | Betfair | V03 |
| Coventry – Sunderland / Coventry | 3.35 (£2,066) | 3.35 (£120) | Same | V04 |
| Coventry – Sunderland / Draw | 3.55 (£4,090) | 3.55 (£2,060) | Same | V04 |
| Coventry – Sunderland / Sunderland | 2.44 (£1,047) | 2.44 (£507) | Same | V04 |
| Bournemouth – Leeds / Under 2.5 | 2.06 (£1,734) | 2.04 (£15) | Matchbook | V05 |
| Bournemouth – Leeds / Over 2.5 | 1.98 (£273) | 1.98 (£34) | Same | V05 |
| Tottenham – Crystal Palace / Under 2.5 | 2.32 (£237) | 2.32 (£270) | Same | V06 |
| Tottenham – Crystal Palace / Over 2.5 | 1.78 (£1,232) | 1.78 (£729) | Same | V06 |
| Coventry – Sunderland / Under 2.5 | 2.02 (£150) | 2.02 (£2) | Same | V07 |
| Coventry – Sunderland / Over 2.5 | 2.00 (£466) | 2.00 (£295) | Same | V07 |
| Hull – Ipswich / Under 2.5 | 2.02 (£3,457) | 2.00 (£7) | Matchbook | V08 |
| Hull – Ipswich / Over 2.5 | 2.02 (£1,297) | 2.02 (£629) | Same | V08 |
| Brentford – Nottingham Forest / Under 2.5 | 2.28 (£148) | 2.30 (£1,294) | Betfair | V09 |
| Brentford – Nottingham Forest / Over 2.5 | 1.80 (£497) | 1.79 (£60) | Matchbook | V09 |
D. Smarkets: all 20 displayed BUY comparisons
| Fixture / selection | Friday | Saturday | Change | Frame IDs |
|---|---|---|---|---|
| Bournemouth – Leeds / Bournemouth | 46% | 49% | +3 pp | FR-SM-overview-Bournemouth / V01-SM |
| Bournemouth – Leeds / Draw | 29% | 29% | +0 pp | FR-SM-overview-Bournemouth / V01-SM |
| Bournemouth – Leeds / Leeds | 28% | 25% | -3 pp | FR-SM-overview-Bournemouth / V01-SM |
| Hull – Ipswich / Hull | 37% | 32% | -5 pp | FR-SM-overview-Hull / V02-SM |
| Hull – Ipswich / Draw | 29% | 28% | -1 pp | FR-SM-overview-Hull / V02-SM |
| Hull – Ipswich / Ipswich | 35% | 41% | +6 pp | FR-SM-overview-Hull / V02-SM |
| Brentford – Nottingham Forest / Brentford | 47% | 46% | -1 pp | FR-SM-overview-Hull / V03-SM |
| Brentford – Nottingham Forest / Draw | 27% | 27% | +0 pp | FR-SM-overview-Hull / V03-SM |
| Brentford – Nottingham Forest / Nottingham Forest | 29% | 29% | +0 pp | FR-SM-overview-Hull / V03-SM |
| Coventry – Sunderland / Coventry | 31% | 31% | +0 pp | FR-SM-overview-Hull / V04-SM |
| Coventry – Sunderland / Draw | 29% | 29% | +0 pp | FR-SM-overview-Hull / V04-SM |
| Coventry – Sunderland / Sunderland | 42% | 43% | +1 pp | FR-SM-overview-Hull / V04-SM |
| Tottenham – Crystal Palace / Under 2.5 | 43% | 45% | +2 pp | FR-SM-Tottenham-OU25 / V06-SM |
| Tottenham – Crystal Palace / Over 2.5 | 60% | 58% | -2 pp | FR-SM-Tottenham-OU25 / V06-SM |
| Coventry – Sunderland / Under 2.5 | 53% | 51% | -2 pp | FR-SM-Coventry-OU25 / V07-SM |
| Coventry – Sunderland / Over 2.5 | 50% | 52% | +2 pp | FR-SM-Coventry-OU25 / V07-SM |
| Hull – Ipswich / Under 2.5 | 50% | 52% | +2 pp | FR-SM-Hull-OU25 / V08-SM |
| Hull – Ipswich / Over 2.5 | 53% | 51% | -2 pp | FR-SM-Hull-OU25 / V08-SM |
| Brentford – Nottingham Forest / Under 2.5 | 46% | 46% | +0 pp | FR-SM-Brentford-OU25 / V09-SM |
| Brentford – Nottingham Forest / Over 2.5 | 57% | 58% | +1 pp | FR-SM-Brentford-OU25 / V09-SM |
Smarkets values above are rounded screen displays. “pp” means percentage points. They are not model probabilities and are not converted into exact decimal prices.
Sources and evidence index
[1] Friday source recording. Supplied file: ScreenRecording_10-30-2026 14-38-42_1.MP4. Recorded-date grouping: 30 October 2026. Matchbook offsets: Brentford 00:18.5; Coventry match result 00:27.5 and totals 00:29.5; Hull match result 00:35.5 and totals 00:36.5. Smarkets offsets: Bournemouth overview 01:27; Brentford totals 02:30; Coventry totals 02:53; Hull totals 03:31; Tottenham totals 04:26; multi-fixture overview including Hull 04:45.
[2] Saturday source recordings. Nine supplied recordings grouped as 31 October 2026. The table below identifies the fixture, market, original shared source and offsets used. These recordings establish the historical quotes; exchange help pages do not.
[3] Betfair Help: Get Started with Betfair Exchange. Definitions of Back and Lay, displayed amounts, and matching uncertainty. Accessed 4 November 2026.
[4] Betfair Help: What is Commission and how is it calculated?. Commission on net market winnings and account-dependent rates. Accessed 4 November 2026.
[5] Smarkets Help: How to calculate implied probability. Reciprocal conversion of decimal odds to implied probability. Accessed 4 November 2026.
[6] Smarkets Help: Why can’t I bet at specific odds?. Percentage-price matching, tick sizes and displayed odds rounding. Accessed 4 November 2026.
Saturday recording index
| ID | Fixture / market | Betfair | Smarkets | Matchbook | Source |
|---|---|---|---|---|---|
| V01 | Bournemouth – Leeds / 1X2 | 1s | 13s | 19s | Original recording |
| V02 | Hull – Ipswich / 1X2 | 1s | 7s | 13s | Original recording |
| V03 | Brentford – Nottingham Forest / 1X2 | 1s | 7s | 16s | Original recording |
| V04 | Coventry – Sunderland / 1X2 | 7s | 16s | 22s | Original recording |
| V05 | Bournemouth – Leeds / Over/Under 2.5 | 1s | 7s | 22s | Original recording |
| V06 | Tottenham – Crystal Palace / Over/Under 2.5 | 1s | 13s | 22s | Original recording |
| V07 | Coventry – Sunderland / Over/Under 2.5 | 1s | 19s | 22s | Original recording |
| V08 | Hull – Ipswich / Over/Under 2.5 | 1s | 7s | 13s | Original recording |
| V09 | Brentford – Nottingham Forest / Over/Under 2.5 | 1s | 9s | 21s | Original recording |
Frame naming: V02-MB means recording V02, Matchbook; BF denotes Betfair and SM denotes Smarkets. Friday frame IDs begin FR-MB or FR-SM. Each full filename and checksum is retained in comparison_data.json. Shared source links may expire; the supplied publication archive preserves the extracted evidence frames. Screenshots are reproduced for analysis; the original platforms’ branding remains visible.

 Betnfair
 OrbitX
 WinFair24
 PS3838